
ループのなかでggplot {ggplot2}を利用して作成した図をリストに格納する一つの方法です。
始めに問題なく格納できるサンプルを確認します。
次のサンプルではループ(iter、4回転)のなかで毎回ランダムにデータ(y、各サイズ(n)は5個)を作成後に散布図を作成してリスト(ggplot_list)に格納し、格納した4つの図をpatchworkで結合して表示しています(Figure 1)。
作成したサンプルデータ(df_sample、Table 1)と比較して何ら問題は見られません。
library(dplyr)
library(ggplot2)
library(patchwork)
set.seed(20250106)
pointsize <- 3
ggplot_list <- list()
n <- 5
iter <- 4
x <- seq(n)
df_sample <- matrix(nrow = n, ncol = iter)
for (ccc in seq(iter)) {
  y <- rnorm(n) %>% round()
  ggplot_list[[ccc]] <- ggplot(data = data.frame(x = x, y = y), mapping = aes(x = x, y = y)) +
    geom_point(size = pointsize) +
    labs(title = ccc) +
    geom_hline(yintercept = 0, colour = "red")
  df_sample[, ccc] <- y
}
Reduce(function(x, y) x + y, ggplot_list)
作成したサンプルデータです。
df_sample [,1] [,2] [,3] [,4]
[1,] -2 -2 -1 -1
[2,] 0 0 -1 0
[3,] 0 0 1 1
[4,] 1 -1 -1 1
[5,] 0 0 0 1続いて始めにループ外で作成したサンプルデータ(df_sample)をループのなかで取り出して、同様に図を作成します(Figure 2)。
4つの図が全て最後のデータ(df_sample( Table 1 )の4列目)の散布図を表示しています。
ggplot_list <- list()
for (ccc in seq(iter)) {
  y <- df_sample[, ccc]
  ggplot_list[[ccc]] <- ggplot(mapping = aes(x = x, y = y)) +
    geom_point(size = pointsize) +
    labs(title = ccc) +
    geom_hline(yintercept = 0, colour = "red")
}
Reduce(function(x, y) x + y, ggplot_list)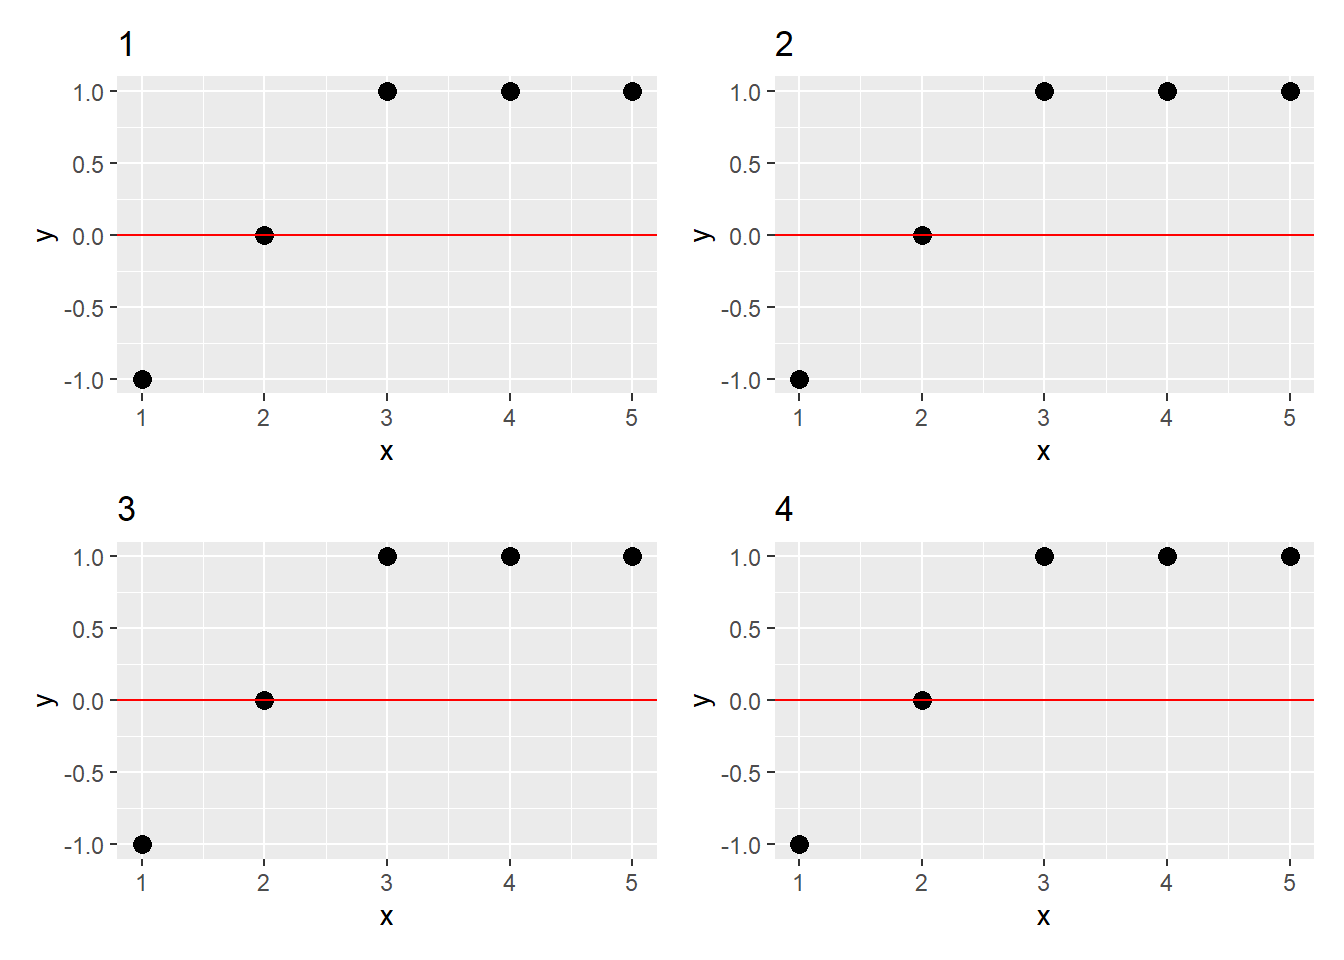
そんなときの一つの解決方法です。
図を作成するコードを関数としてループの外に出してしまいます(Figure 3)。
問題なく表示され、Figure 1 と Figure 3 が同一であることが確認できます。
fun_plot <- function(ccc) {
  y <- df_sample[, ccc]
  ggplot(mapping = aes(x = x, y = y)) +
    geom_point(size = pointsize) +
    labs(title = ccc) +
    geom_hline(yintercept = 0, colour = "red")
}
ggplot_list <- list()
for (ccc in seq(iter)) {
  ggplot_list[[ccc]] <- fun_plot(ccc = ccc)
}
Reduce(function(x, y) x + y, ggplot_list)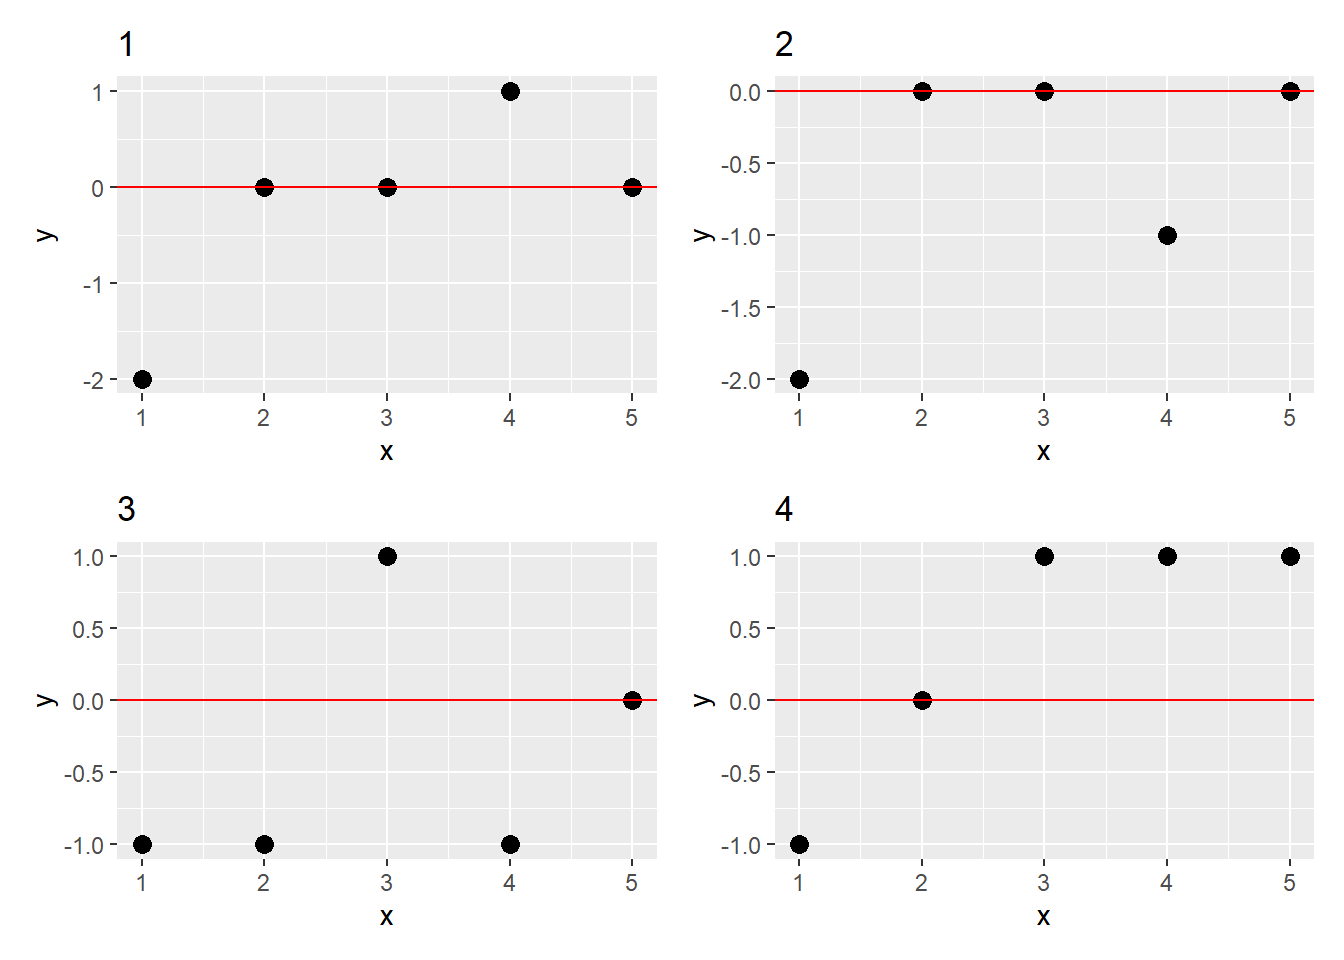
以上です。