
関数名: plot_sun_path
指定した日の「日の出」から「日の入り」までの太陽の軌跡(方位と高度)を計算し、グラフとして描画する関数です。
本ポストはこちらの続きです。下記コード中の関数 get_sun_position もこちらで確認してください。

Rで自作関数:get_sun_position
関数名: get_sun_position緯度、経度、日時を入力として受け取り、度(Degrees)単位で高度と方位(北=0°, 東=90°, 南=180°, 西=270°)を返す関数です。参照資料 : #' 太陽の高度と方位を計算する関数...
www.saecanet.com
2026.04.03
# パッケージの読み込み
library(ggplot2)

plot_sun_path <- function(date, lat, lon, tz = "Asia/Tokyo") {

  target_date <- as.Date(date)

  # --- Step 1: 指定日の00:00から23:59まで「1分間隔」の時刻ベクトルを作成 ---
  start_time <- as.POSIXct(sprintf("%s 00:00:00", target_date), tz = tz)
  end_time   <- as.POSIXct(sprintf("%s 23:59:00", target_date), tz = tz)
  time_seq_1min <- seq(start_time, end_time, by = "1 min")

  # --- Step 2: 1日分の高度と方位を一括計算 ---
  sun_pos_all <- get_sun_position(lat = lat, lon = lon, datetime = time_seq_1min)
  df_all <- data.frame(
    datetime  = time_seq_1min,
    elevation = sun_pos_all$elevation,
    azimuth   = sun_pos_all$azimuth
  )

  # --- Step 3: 日の出と日の入りの判定 ---
  # 「日の出・日の入り」は、太陽の上辺が地平線に接する瞬間(高度 約 -0.833度)と定義します
  df_daylight <- subset(df_all, elevation >= -0.833)

  if (nrow(df_daylight) == 0) stop("指定された日付・緯度では、1日中太陽が昇りません(極夜)。")
  if (nrow(df_daylight) == nrow(df_all)) stop("指定された日付・緯度では、1日中太陽が沈みません(白夜)。")

  # 最初の時刻が日の出、最後の時刻が日の入り
  sunrise_time <- min(df_daylight$datetime)
  sunset_time  <- max(df_daylight$datetime)

  # --- Step 4: グラフ用のデータ整形 ---
  # グラフが重くなりすぎないよう、軌跡データは5分間隔に間引く
  is_5min_interval <- as.numeric(format(df_daylight$datetime, "%M")) %% 5 == 0
  df_plot <- df_daylight[is_5min_interval, ]

  # 日の出と日の入りの時刻が抜けないように手動で追加して並び替え
  df_plot <- rbind(df_plot, df_daylight[c(1, nrow(df_daylight)), ])
  df_plot <- df_plot[!duplicated(df_plot$datetime), ]
  df_plot <- df_plot[order(df_plot$datetime), ]

  # --- Step 5: グラフ上に表示する「時刻ラベル用」のデータを作成 ---
  is_on_the_hour <- format(df_plot$datetime, "%M") == "00"
  df_labels <- rbind(
    df_plot[1, ],                       # 日の出
    df_plot[is_on_the_hour, ],          # 毎正時(00分)
    df_plot[nrow(df_plot), ]            # 日の入り
  )
  df_labels <- df_labels[!duplicated(df_labels$datetime), ]
  df_labels <- df_labels[order(df_labels$datetime), ]

  # --- Step 6: ggplot2 で軌跡をプロット ---
  p <- ggplot(df_plot, aes(x = azimuth, y = elevation)) +
    geom_hline(yintercept = 0, color = "gray50", linewidth = 1) +

    geom_path(aes(color = as.numeric(datetime)), linewidth = 1.5, show.legend = FALSE) +
    scale_color_viridis_c(option = "C") +

    geom_point(data = df_labels, size = 2, color = "red") +
    geom_text(
      data = df_labels,
      aes(label = format(datetime, "%H:%M")),
      vjust = -1, hjust = 0.5, size = 3.5, color = "black"
    ) +

    scale_x_continuous(
      limits = c(min(df_plot$azimuth) - 15, max(df_plot$azimuth) + 15),
      breaks = seq(0, 360, by = 45),
      labels = function(x) {
        dir_names <- c("0" = "北(0°)", "45" = "北東(45°)", "90" = "東(90°)",
                       "135" = "南東(135°)", "180" = "南(180°)", "225" = "南西(225°)",
                       "270" = "西(270°)", "315" = "北西(315°)", "360" = "北(360°)")
        res <- dir_names[as.character(x)]
        ifelse(is.na(res), paste0(x, "°"), res)
      }
    ) +

    scale_y_continuous(
      limits = c(-2, max(df_plot$elevation) + 10),
      breaks = seq(0, 90, by = 10)
    ) +

    labs(
      title = sprintf("太陽の軌跡 (%s)", target_date),
      subtitle = sprintf("緯度: %.4f, 経度: %.4f\n日の出: %s / 日の入り: %s",
                         lat, lon,
                         format(sunrise_time, "%H:%M"),
                         format(sunset_time, "%H:%M")),
      x = "方位 (Azimuth)",
      y = "高度 (Elevation)"
    ) +

    theme_minimal(base_size = 12) +
    theme(
      plot.title = element_text(face = "bold", size = 16),
      panel.grid.minor = element_blank()
    )

  return(p)
}
実行例
# 東京の緯度経度
my_lat <- 35.689
my_lon <- 139.691
# 夏至(2026年6月21日)のプロット
plot_summer <- plot_sun_path(date = "2026-06-21", lat = my_lat, lon = my_lon)
print(plot_summer)
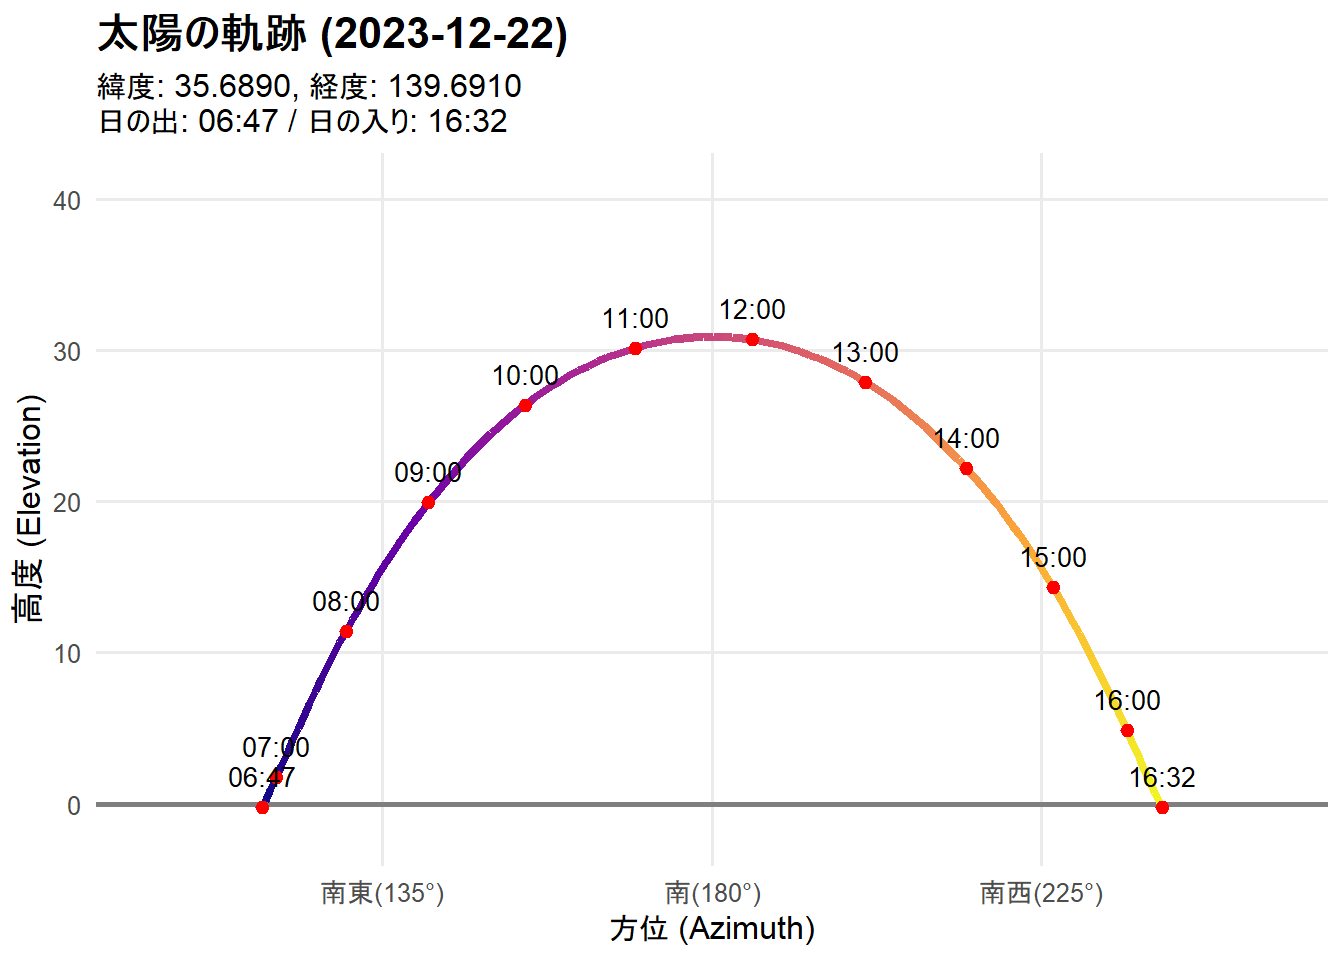
# 冬至(2026年12月22日)のプロット
plot_winter <- plot_sun_path(date = "2023-12-22", lat = my_lat, lon = my_lon)
print(plot_winter)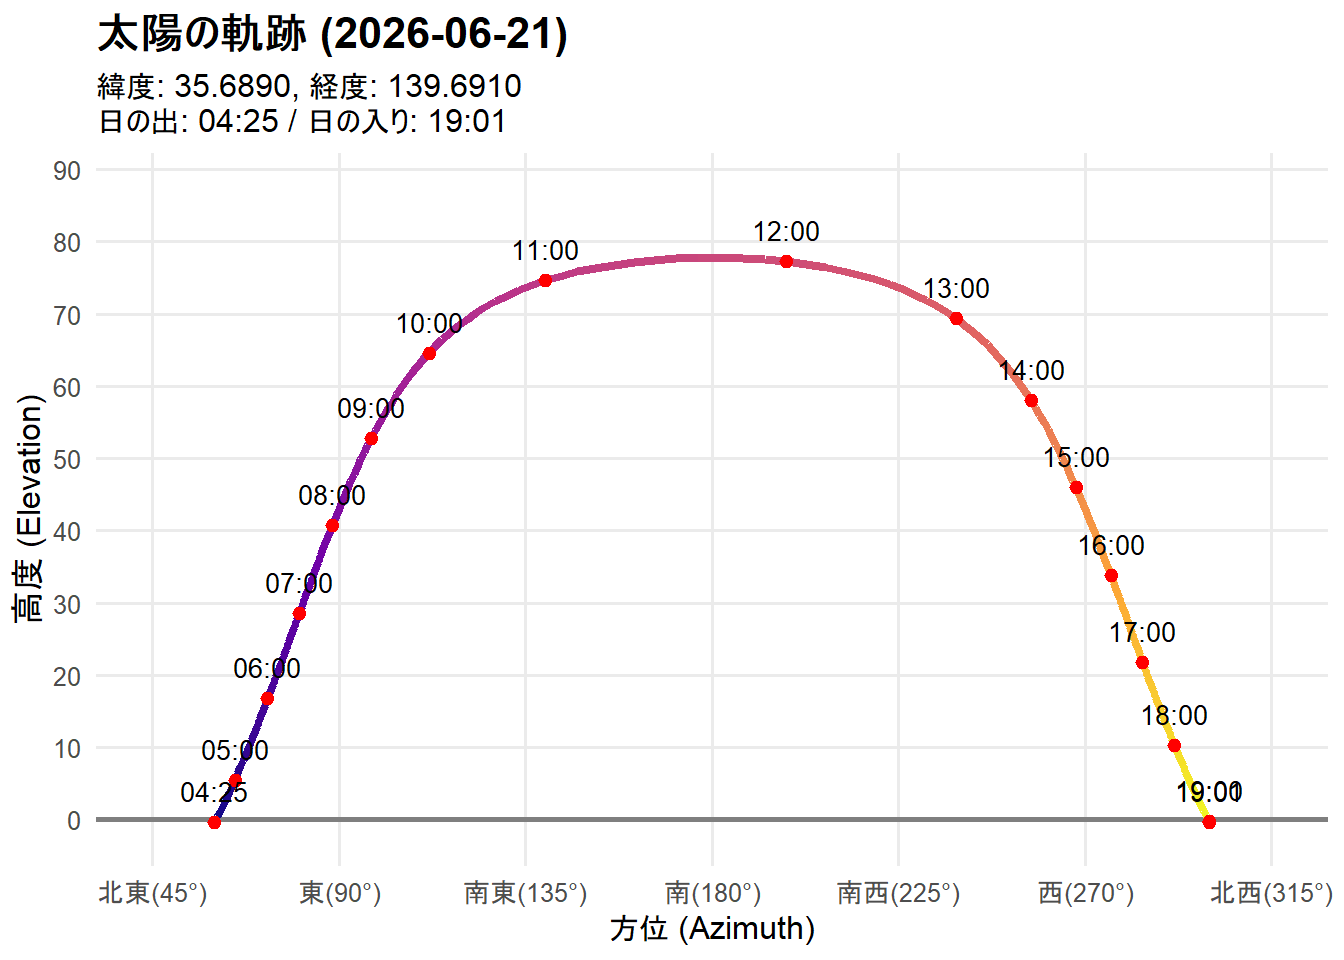
以上です。